
📌 Highlights
IMRouter targets a specific failure mode in LLM-based forecasting: temporal pattern imbalance causes common local dynamics to dominate the shared optimization signal, leaving less frequent dynamics with higher errors. The paper combines sparse expert routing with routing-aware cross-modal alignment and reports improvements on long-term, short-term, few-shot, pattern-wise, and ablation evaluations.
The strongest evidence is internally consistent with the proposed mechanism: the full model reaches 0.171 MSE and 0.263 MAE on ECL and 0.423 MSE and 0.285 MAE on Traffic in the ablation table, while the pattern-wise Traffic analysis reports the lowest MSE across all six clusters and an approximate Cluster 6 MSE of 0.78.
- Core claim: frequency imbalance in recurring temporal patterns biases both temporal encoders and semantic prototype alignment.
- Main method: PATR uses gradient-conflict and density-aware routing; RGSA preserves routing information during cross-modal alignment.
- Reported long-term evaluation covers ETTh1, ETTh2, ETTm1, ETTm2, Weather, ECL, and Traffic.
- Reported short-term evaluation on M4 gives sMAPE 11.77, MASE 1.568, and OWA 0.844.
- Key caveat: transfer beyond the GPT-2 backbone and the reported datasets is not established.
🎯 Introduction
The paper frames time-series forecasting as important for website traffic prediction, cloud workload management, online service demand, traffic monitoring, and resource management. LLM-based forecasters commonly use a represent-then-align paradigm: a temporal encoder extracts representations, an alignment module maps them toward text prototypes derived from a frozen LLM vocabulary, and the system is trained with forecasting loss.
The paper argues that existing methods focus mainly on the modality gap between continuous time series and discrete text while overlooking the unequal frequency of local temporal patterns. Using TS2Vec representations and HDBSCAN clustering for analysis, the authors identify skewed cluster sizes and generally higher errors for less frequent clusters. IMRouter therefore aims to reduce frequency-induced bias in temporal representation learning and semantic alignment without manually assigned pattern labels.
🔬 Methodology
The forecasting backbone normalizes each channel, divides it into sliding-window patches, and maps the patches into temporal tokens. Temporal tokens are aligned with compressed text prototypes through cross-attention and then processed by a frozen LLM. The paper's key motivation is expressed by Eq. (5): the aggregate loss weights each pattern-specific loss by $\frac{|D_j|}{|D|}$, and Eq. (7) consequently weights its gradient contribution by the same empirical frequency.
PATR replaces a single shared temporal transformation with sparse mixture-of-experts routing. Eq. (8) computes patch-level assignment probabilities and Eq. (9) combines the selected experts. After an initial warm-up, the method penalizes incompatible assignments using the positive negative-cosine conflict score in Eq. (10). It estimates local density from normalized shared-router gradients and applies inverse-density weighting so sparsely represented optimization directions receive greater relative influence.
RGSA applies cross-attention to the PATR representations and transfers routing information to the aligned representation. The paper formulates this as mutual-information maximization and implements it with routing-guided semantic distillation: Eq. (19) minimizes KL divergence between the stop-gradient router distribution and a predictor inferred from the aligned representation. The complete training objective in Eq. (20) combines prediction, load balancing, density-weighted gradient conflict, and semantic distillation; RGSA is activated midway through training to avoid unstable early routing supervision.
equation 5
Meaning: Decomposes the overall forecasting objective by temporal pattern and exposes the empirical-frequency weighting that favors frequent patterns.
equation 8
Meaning: Produces the router's expert-assignment distribution for each patch.
equation 9
Meaning: Combines the selected top-k expert outputs into the PATR temporal representation.
equation 10
Meaning: Measures incompatible optimization directions for two patches assigned to the same expert.
📊 Experiments
For long-term forecasting, the paper evaluates ETTh1, ETTh2, ETTm1, ETTm2, Weather, Electricity (ECL), and Traffic with input length 96 and prediction horizons 96, 192, 336, and 720. It reports MSE and MAE, where lower values are better, against TimeSup, FSCA, CALF, Time-LLM, GPT4TS, PatchTST, iTransformer, and TimesNet. The reported aggregate comparison is provided in tab:long_term_forecasting: IMRouter has 0.171 MSE and 0.263 MAE on ECL, and 0.423 MSE and 0.285 MAE on Traffic.
For short-term forecasting, the M4 benchmark contains 100,000 univariate series across Yearly, Quarterly, Monthly, Weekly, Daily, and Hourly frequencies. The paper reports sMAPE, MASE, and OWA, with lower values better, averaged across the Yearly, Quarterly, Monthly, and Other subsets. IMRouter reports 11.77 sMAPE, 1.568 MASE, and 0.844 OWA, compared with FSCA's 11.828, 1.580, and 0.850.
The few-shot setting trains on 10% of the available samples and averages over horizons 96, 192, 336, and 720 on ETTm1, ETTm2, ETTh1, and ETTh2. IMRouter ranks first or second on six of eight reported metrics and reaches 0.498 MSE and 0.457 MAE on ETTm1 and 0.292 MSE and 0.330 MAE on ETTm2. The ablation table shows progressive gains from Vanilla MoE to PATR, RGSA, density weighting, and full IMRouter; on ECL, full IMRouter improves from 0.177 to 0.171 MSE over PATR w/o Density + RGSA, while on Traffic it improves from 0.430 to 0.423.
The pattern-wise Traffic experiment reports the lowest IMRouter MSE across all six frequency-ranked clusters, with stronger improvements on less frequent clusters; the paper gives an approximate Cluster 6 MSE of 0.78 versus 0.85–0.93 for competing methods. Sensitivity experiments on ECL and Traffic find k=2 best for the number of selected experts and expert dimension 256 best among the tested settings.
tab:long_term_forecasting
Caption: Long-term forecasting results averaged over four prediction horizons on seven benchmarks. The best and second-best results are shown in bold and underlined, respectively.
| Dataset | IMRouter MSE | IMRouter MAE | TimeSup MSE | TimeSup MAE | FSCA MSE | FSCA MAE | CALF MSE | CALF MAE | Time-LLM MSE | Time-LLM MAE | GPT4TS MSE | GPT4TS MAE | PatchTST MSE | PatchTST MAE | iTransformer MSE | iTransformer MAE | TimesNet MSE | TimesNet MAE |
|---|---|---|---|---|---|---|---|---|---|---|---|---|---|---|---|---|---|---|
| ETTm1 | 0.389 | 0.389 | 0.402 | 0.407 | 0.473 | 0.437 | 0.393 | 0.391 | 0.410 | 0.409 | 0.389 | 0.397 | 0.388 | 0.402 | 0.407 | 0.411 | 0.410 | 0.418 |
| ETTm2 | 0.279 | 0.321 | 0.284 | 0.329 | 0.282 | 0.326 | 0.282 | 0.322 | 0.285 | 0.331 | 0.258 | 0.331 | 0.290 | 0.333 | 0.291 | 0.334 | 0.295 | 0.332 |
| ETTh1 | 0.442 | 0.437 | 0.464 | 0.450 | 0.429 | 0.436 | 0.411 | 0.439 | 0.460 | 0.449 | 0.447 | 0.436 | 0.448 | 0.447 | 0.464 | 0.455 | 0.460 | 0.455 |
| ETTh2 | 0.372 | 0.397 | 0.402 | 0.419 | 0.372 | 0.401 | 0.376 | 0.404 | 0.389 | 0.408 | 0.381 | 0.408 | 0.384 | 0.413 | 0.383 | 0.407 | 0.407 | 0.421 |
| Weather | 0.250 | 0.269 | 0.259 | 0.279 | 0.260 | 0.280 | 0.246 | 0.271 | 0.274 | 0.290 | 0.264 | 0.284 | 0.258 | 0.280 | 0.260 | 0.281 | 0.259 | 0.285 |
| ECL | 0.171 | 0.263 | 0.192 | 0.281 | 0.194 | 0.278 | 0.193 | 0.278 | 0.223 | 0.309 | 0.205 | 0.290 | 0.204 | 0.294 | 0.175 | 0.266 | 0.197 | 0.297 |
| Traffic | 0.423 | 0.285 | 0.442 | 0.288 | 0.457 | 0.293 | 0.459 | 0.303 | 0.541 | 0.358 | 0.488 | 0.317 | 0.482 | 0.308 | 0.428 | 0.285 | 0.625 | 0.331 |
Why It Matters: It reports the main long-term comparison across energy, weather, and transportation benchmarks using MSE and MAE.
tab:m4_results
Caption: Average short-term forecasting performance on the M4 dataset. The results are averaged across the Yearly, Quarterly, Monthly, and Other subsets. The best results are shown in bold, and the second-best results are underlined.
| Metric | IMRouter | FSCA | Time-LLM | GPT4TS | PatchTST | iTransformer | TimesNet |
|---|---|---|---|---|---|---|---|
| SMAPE | 11.77 | 11.828 | 12.494 | 12.365 | 12.059 | 12.142 | 12.880 |
| MASE | 1.568 | 1.580 | 1.731 | 1.767 | 1.623 | 1.632 | 1.836 |
| OWA | 0.844 | 0.850 | 0.913 | 0.918 | 0.869 | 0.874 | 0.955 |
Why It Matters: It shows that IMRouter reports the lowest sMAPE, MASE, and OWA on the averaged M4 short-term evaluation.
tab:fewshot_results
Caption: Few-shot forecasting performance on four ETT datasets. Results are averaged over the available prediction horizons. Lower MSE and MAE indicate better performance. The best results are highlighted in bold, and the second-best results are underlined.
| Dataset | IMRouter MSE | IMRouter MAE | FSCA MSE | FSCA MAE | CALF MSE | CALF MAE | Time-LLM MSE | Time-LLM MAE | GPT4TS MSE | GPT4TS MAE | PatchTST MSE | PatchTST MAE | iTransformer MSE | iTransformer MAE | TimesNet MSE | TimesNet MAE | DLinear MSE | DLinear MAE |
|---|---|---|---|---|---|---|---|---|---|---|---|---|---|---|---|---|---|---|
| ETTm1 | 0.498 | 0.457 | 0.602 | 0.503 | 0.504 | 0.462 | 0.565 | 0.491 | 0.607 | 0.498 | 0.619 | 0.496 | 0.580 | 0.497 | 0.674 | 0.535 | 0.568 | 0.500 |
| ETTm2 | 0.292 | 0.330 | 0.302 | 0.339 | 0.302 | 0.330 | 0.303 | 0.341 | 0.303 | 0.337 | 0.302 | 0.342 | 0.306 | 0.344 | 0.322 | 0.355 | 0.329 | 0.383 |
| ETTh1 | 0.643 | 0.541 | 0.695 | 0.553 | 0.644 | 0.541 | 0.616 | 0.530 | 0.688 | 0.554 | 0.623 | 0.532 | 0.748 | 0.587 | 0.864 | 0.625 | 0.647 | 0.552 |
| ETTh2 | 0.419 | 0.425 | 0.403 | 0.416 | 0.419 | 0.427 | 0.497 | 0.465 | 0.574 | 0.495 | 0.490 | 0.459 | 0.443 | 0.443 | 0.487 | 0.468 | 0.446 | 0.461 |
Why It Matters: It tests whether the imbalance-aware routing approach remains useful when only 10% of the available training samples are used.
fig:pic1
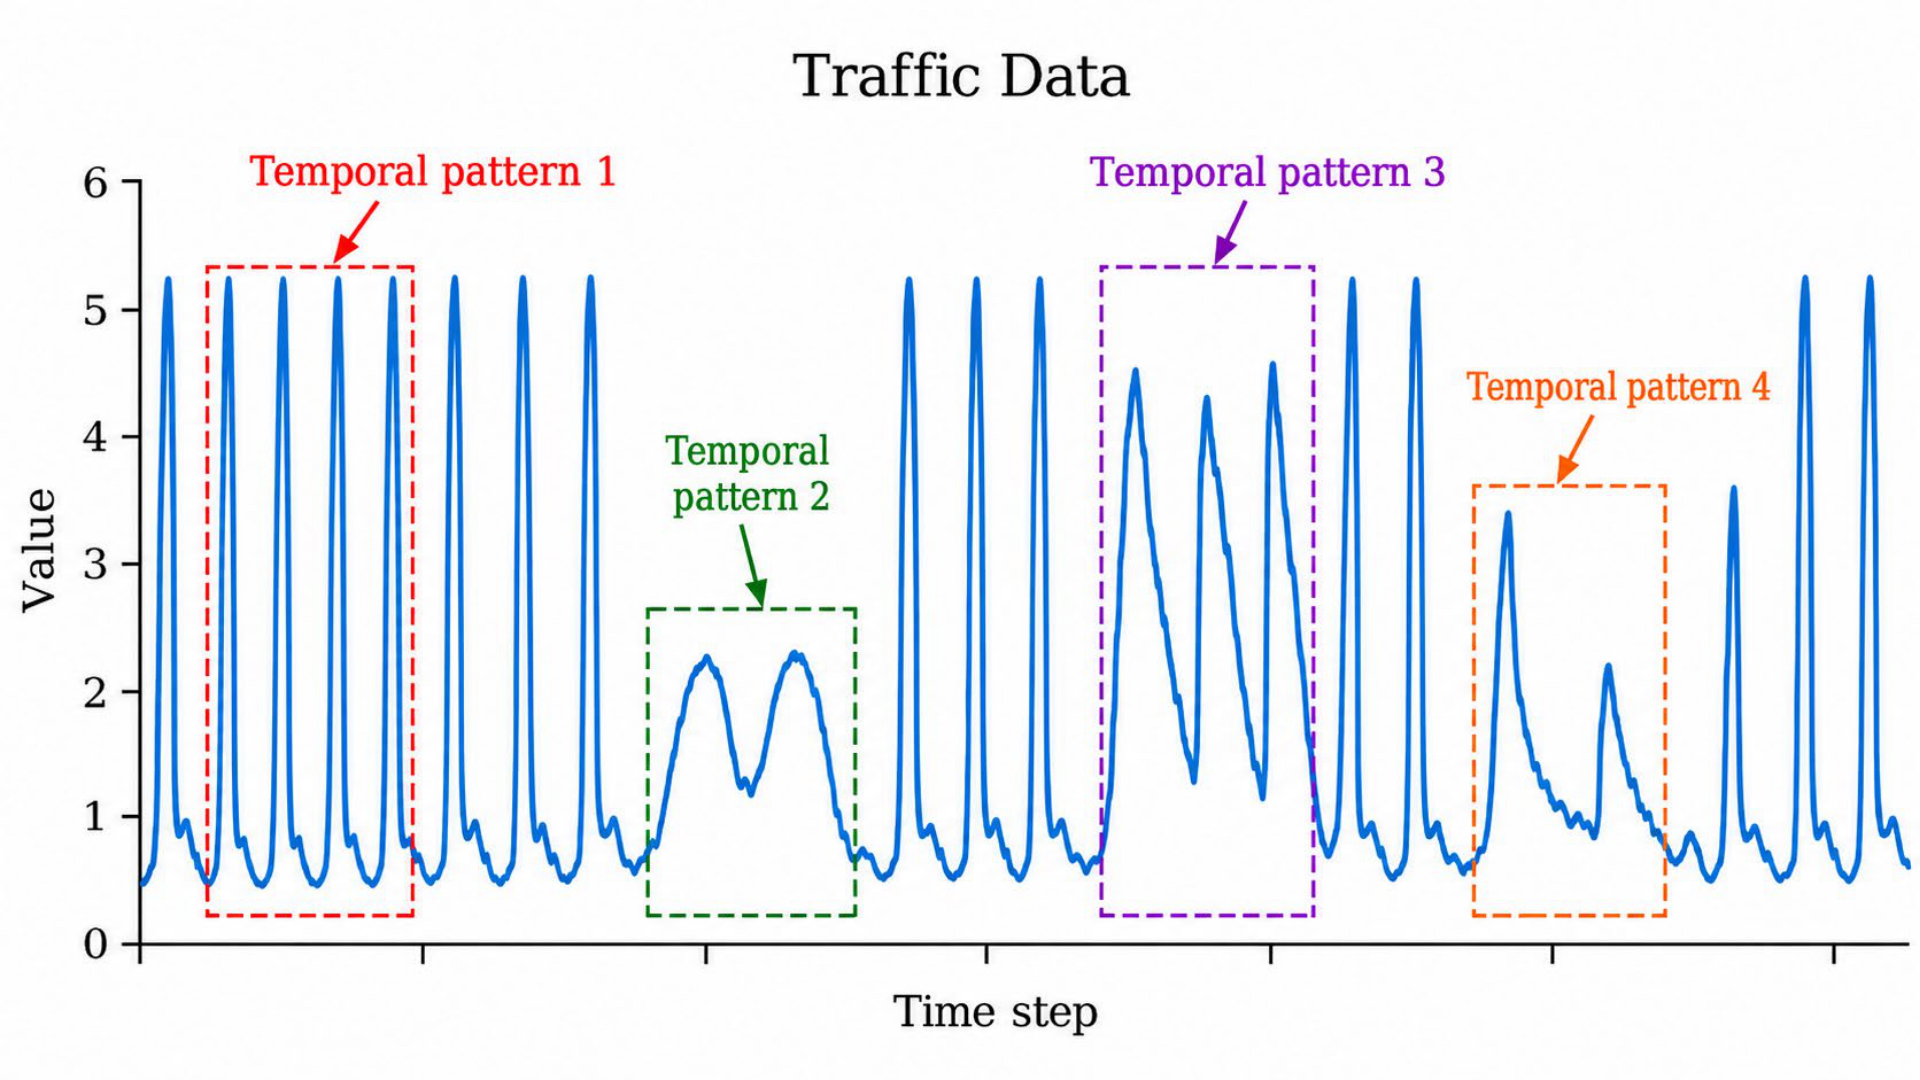
Caption: Illustration of temporal pattern diversity in a time series. Frequently recurring peak-shaped patterns coexist with less frequent, smoother local patterns (highlighted by red dashed boxes), demonstrating the heterogeneity of temporal dynamics.
Why It Matters: It motivates the central problem by showing why a single average forecasting objective must handle multiple local temporal regimes.
fig:pic2
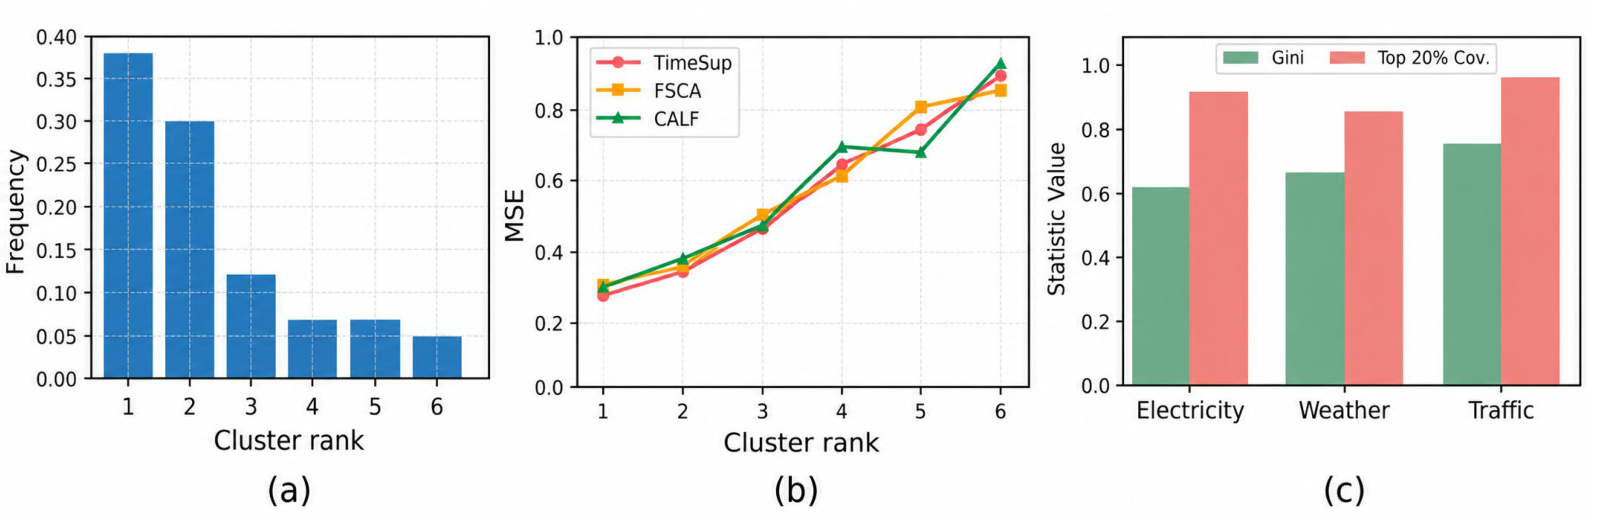
Caption: (a) Frequency distribution of temporal pattern clusters identified from a representative channel in the Traffic dataset, ranked by cluster size in descending order. (b) Cluster-wise forecasting errors (MSE) of three existing methods on the same clusters, showing generally higher errors for less frequent patterns. (c) Dataset-level TPI statistics across Electricity, Weather, and Traffic. Gini measures the inequality of cluster sizes, while Top-20 \% Coverage denotes the proportion of samples covered by the largest 20 \% of clusters.
Why It Matters: It provides the paper's main empirical diagnosis: pattern frequencies are skewed and less frequent clusters generally have higher forecasting error.
fig:pic3
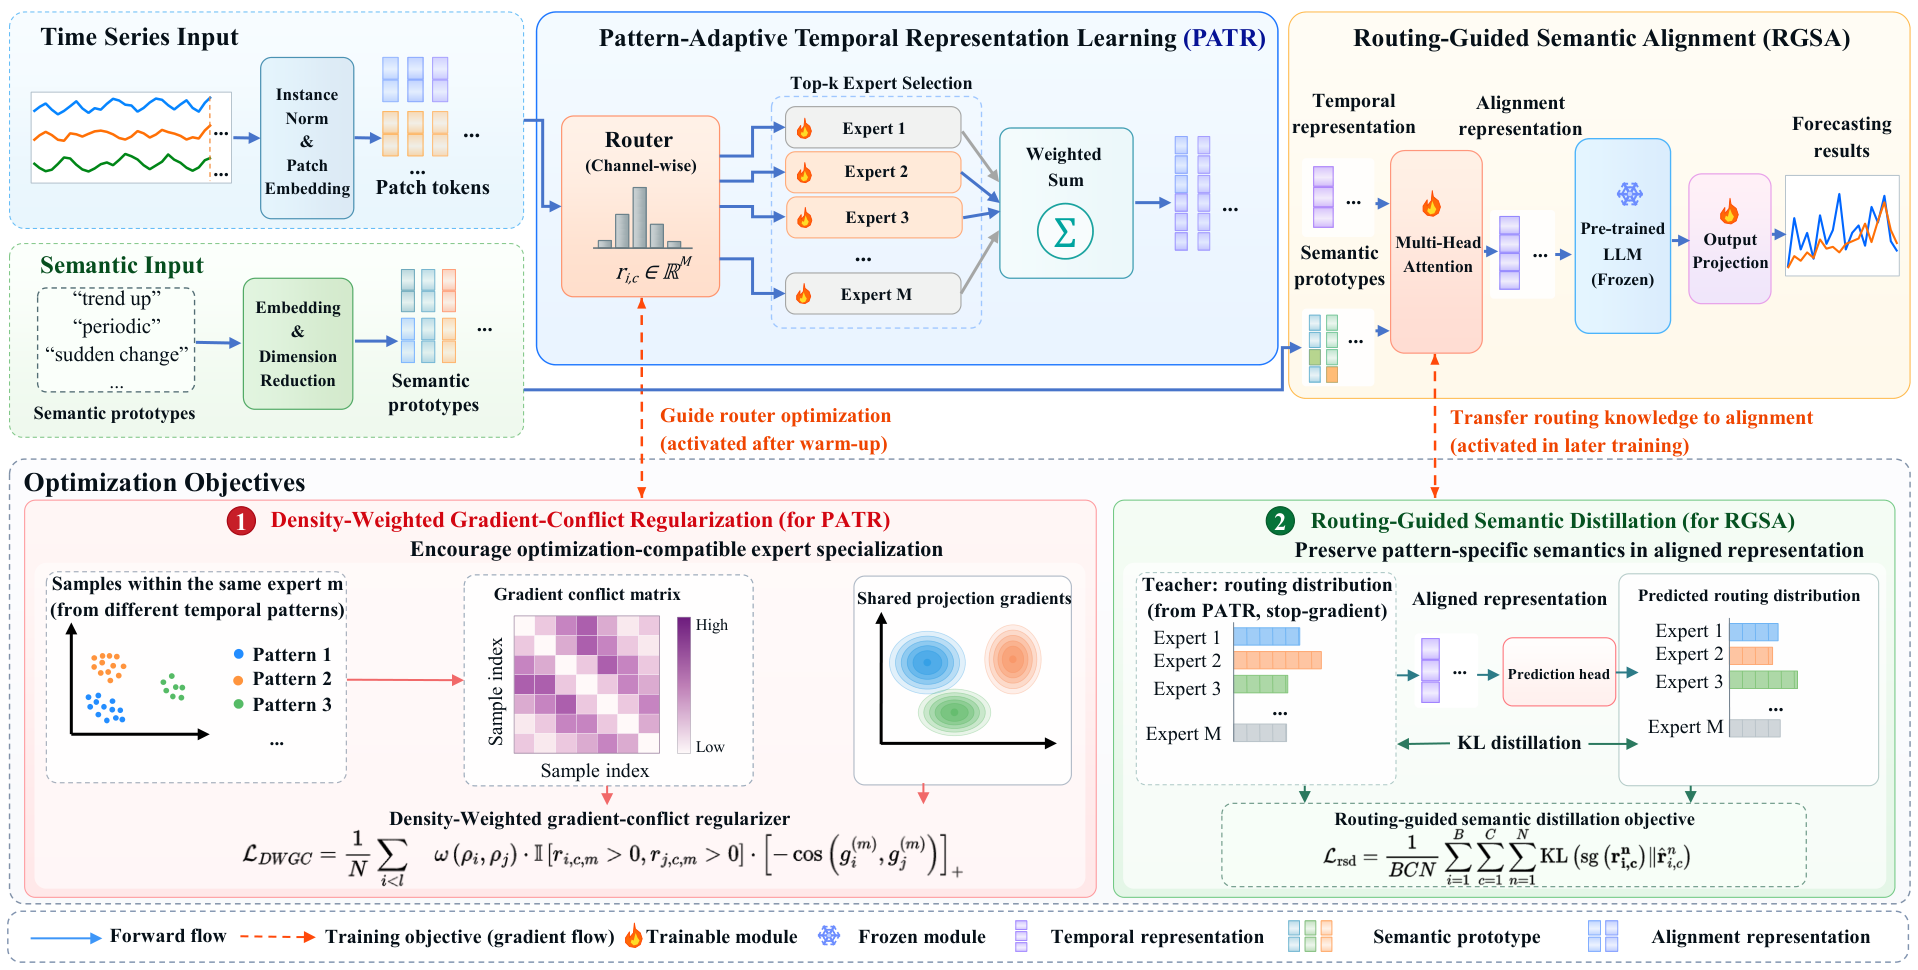
Caption: Illustration of IMRouter
Why It Matters: It shows how PATR, RGSA, the frozen LLM, and the auxiliary optimization objectives fit together.
fig:patter-wise
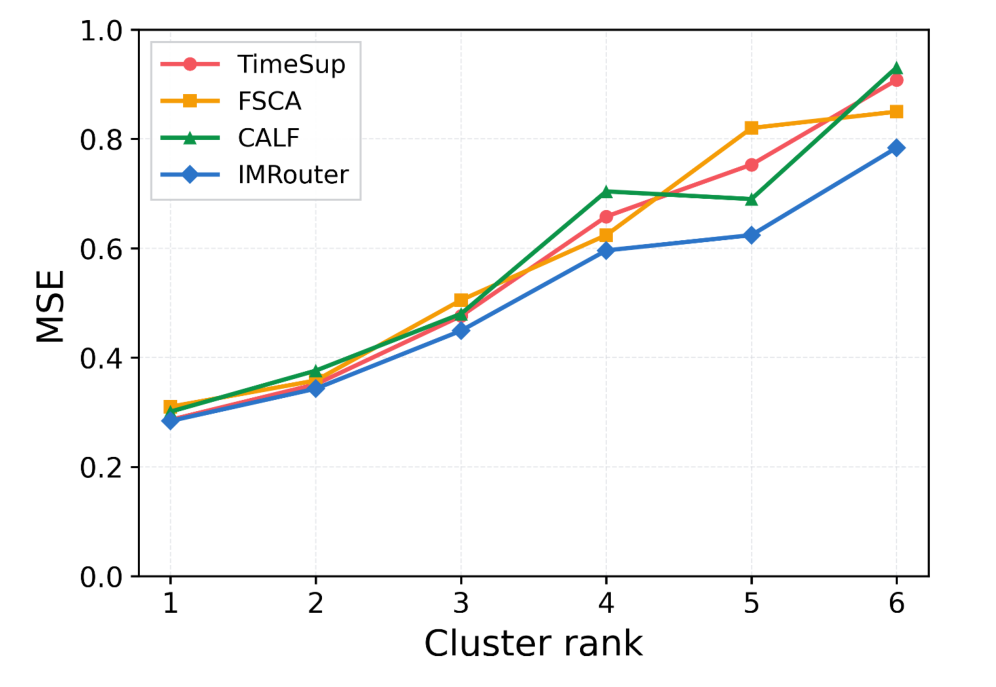
Caption: Pattern-wise forecasting performance of IMRouter and three baseline methods on the Traffic dataset.
Why It Matters: It directly evaluates the claimed mechanism by comparing errors across clusters ordered by occurrence frequency.
sensitity
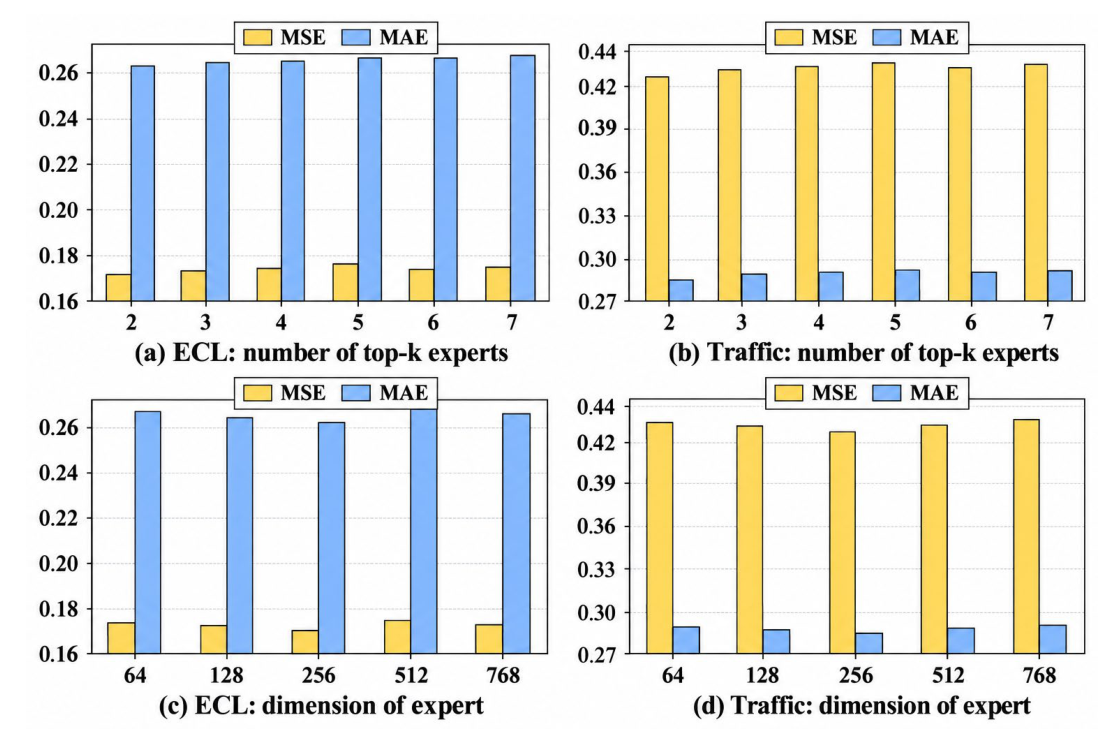
Caption: Hyperparameter sensitivity results on the number of top-k experts and the dimension of experts.
Why It Matters: It tests how routing sparsity and expert capacity affect forecasting error on ECL and Traffic.
🔮 Conclusion
The paper concludes that temporal pattern imbalance is a meaningful source of bias in LLM-based time-series forecasting. IMRouter addresses it at two linked points in the pipeline: PATR reduces optimization interference through gradient-guided expert routing, and RGSA preserves the resulting pattern-specific information during cross-modal semantic alignment.
Across the reported benchmarks, the method improves average forecasting metrics and shows especially clear benefits for underrepresented Traffic patterns. The evidence supports the value of treating temporal frequency imbalance as distinct from abrupt changes, non-stationarity, and extreme events.
🛠️ Future Research Improvements
The main body does not provide a detailed future-work agenda, so the following are evidence-grounded research questions rather than stated paper claims. The next evaluation should test whether the method remains effective with other frozen LLM backbones, since the reported comparisons standardize LLM-based models on GPT-2.
The pattern-wise conclusions could be strengthened by replacing or complementing TS2Vec-plus-HDBSCAN diagnostics with alternative representations, clustering procedures, or directly measured recurring regimes. Broader few-shot curves, explicit compute and latency accounting, and tests across more operational domains would clarify deployment trade-offs.
🏭 Potential Industry Use Scenarios
The paper's stated application areas map naturally to workload forecasting for web services and cloud resources, where frequent weekday patterns may coexist with less frequent weekend or special-event cycles. More reliable rare-pattern forecasts could support capacity planning, autoscaling, traffic routing, and service-level protection.
The benchmark coverage also suggests energy-demand forecasting, weather-sensitive operations, transportation-flow prediction, and other multivariate monitoring systems as plausible use cases. A production implementation would need to validate routing stability, memory overhead, latency, and performance under distribution shifts not evaluated in the supplied main body.
💬 Critical Analysis
The strongest aspect of IMRouter is that its mechanism is tied to an explicit optimization diagnosis rather than only adding capacity: Eq. (5) identifies frequency-weighted gradients, the ablation study separates vanilla expert routing from gradient-guided routing and density weighting, and the pattern-wise Traffic experiment directly examines errors by frequency. The complementary PATR and RGSA design also addresses both representation learning and cross-modal alignment.
The main uncertainty is external validity. The experiments use a CALF-based implementation, channel-wise routing, a GPT-2 backbone, selected public benchmarks, and a narrow sensitivity study. The supplied evidence does not establish the computational cost of gradient-based routing, the stability of density estimates under changing batch composition, or the behavior of the method when temporal patterns evolve over time.
Reproducibility is helped by the reported Python 3.10 and PyTorch 2.1.3 environment, Adam optimization, fixed random seed 2021, hyperparameter search spaces, two RTX 4090 GPUs, and early-stopping settings. A builder should nevertheless verify the exact warm-up and RGSA activation schedules, auxiliary-loss coefficients, pair-sampling strategy, and expert capacity constraints before treating the reported numbers as directly reproducible.